Using Wireshark to Capture Packets for Syslog Viewer
You can use Wireshark (through Syslog Viewer) to capture syslog messages instead of (or in addition to) using Syslog Viewer to listen on the UDP/TCP port. Wireshark is used only to capture the syslog messages; everything else is done on Syslog Viewer (e.g., displaying and filtering messages).
Using Wireshark is useful because Syslog Viewer can't listen to the same UDP/TCP port (514) that a third-party syslog server (or another instance of Syslog Viewer) running on your computer is currently using to capture the syslog messages. In addition, you may have multiple people using the same computer and running multiple syslog server instances.
To overcome this, you can use Syslog Viewer as follows:
|
■
|
Start two instances of Syslog Viewer, where one instance listens to port 514 "normally", and the other instance uses Wireshark to listen to the same port. |
|
■
|
Have a third-party syslog server listen to port 514, start Syslog Viewer and trigger it to use Wireshark to listen (capture) the messages on the same port. |
It also supports extracting logs from IP Trace debug capture stream (i.e., you can keep the device sending syslog to the "normal" destination (not your PC) and temporarily send IP Trace debug captures to your PC for some quick debugging.
You must have Wireshark installed on your computer.
|
➢
|
To view syslog messages in Wireshark: |
|
1.
|
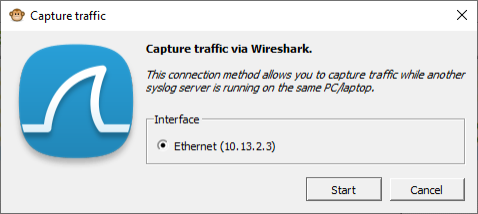
On the toolbar, click the Network Capture (via Wireshark)  icon; the following appears: icon; the following appears: |
|
2.
|
Under the Interface group, select the interface (if more than one NIC exists on your computer). |
|
3.
|
Click Start; the 'Syslog Listener' field on the status bar displays "Wireshark". Wireshark starts capturing syslog messages and Syslog Viewer displays them. |
|
4.
|
To stop using Wireshark with Syslog Viewer, on the toolbar, click the Stop Network Capture  icon. icon. |